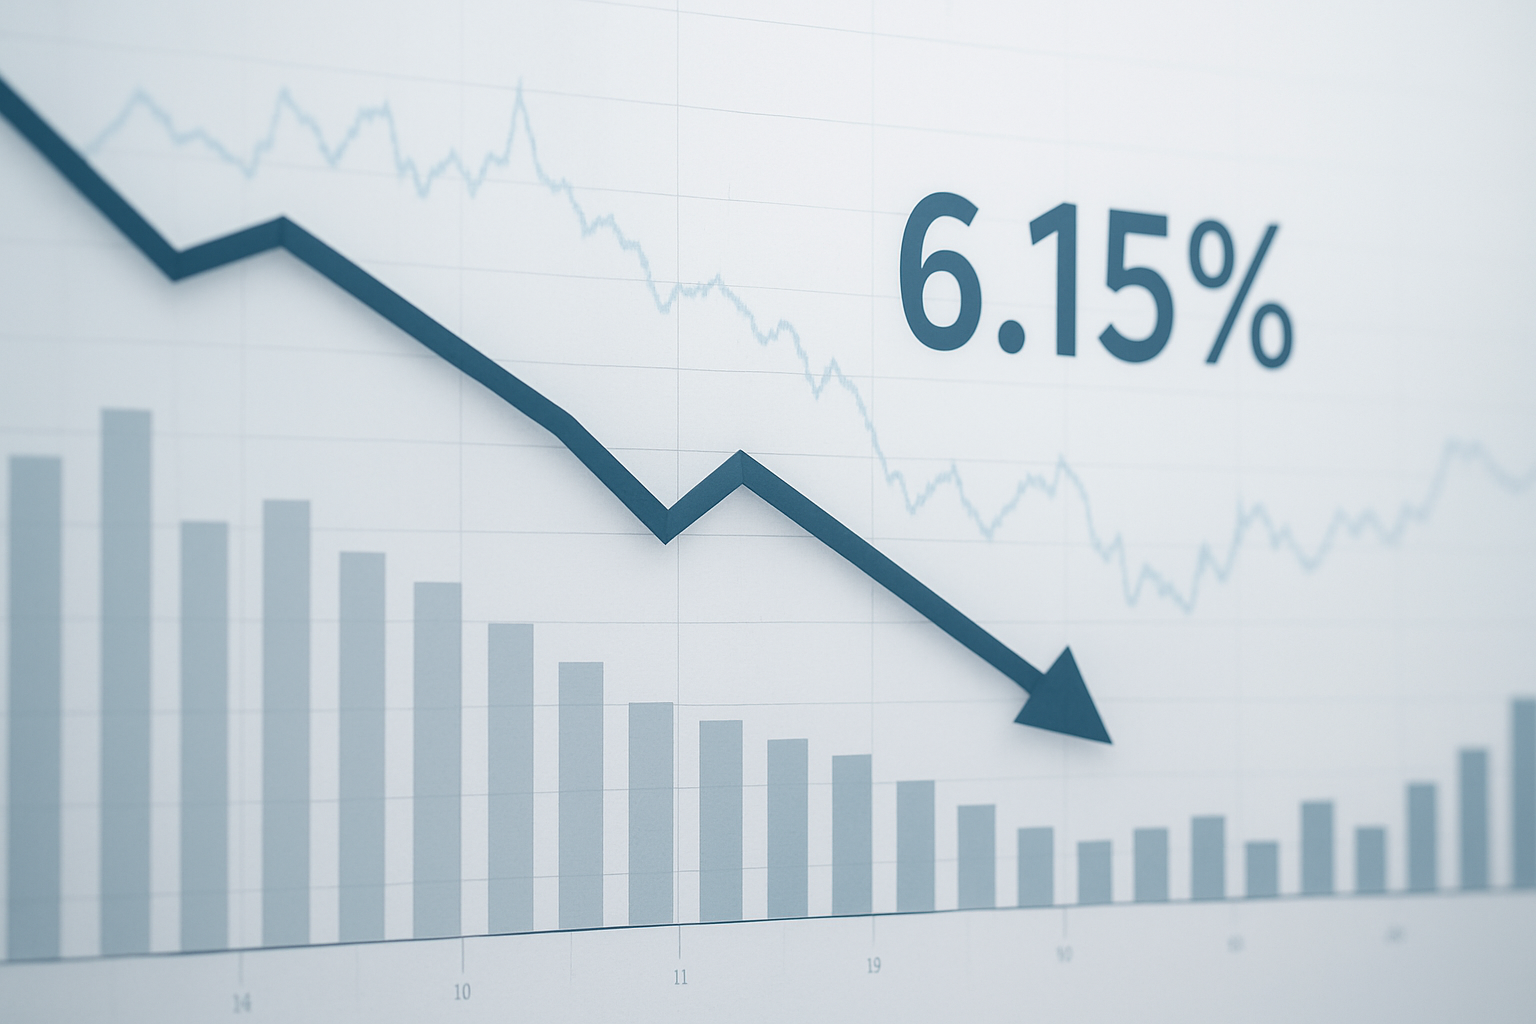
6.15% vs. Historical Highs: What This Drop Really Means
Mortgage rates dropped to 6.15% last week, and homebuyers, real estate investors, and financial planners want to know what this really means after months of climbing rates.
This analysis is for anyone making housing decisions right now or planning their next financial move in this shifting rate environment.
We’ll examine how 6.15% compares to the dramatic peaks we’ve seen recently and what historical data tells us about where rates might head next. You’ll also discover the real-world impact on different market segments and the strategic opportunities that smart investors are already spotting in this new rate landscape.
Understanding the Current 6.15% Rate in Context
Historical Comparison of Rates Over the Past Decade
The 6.15% rate we’re seeing today tells a compelling story when placed against the backdrop of the past ten years. Back in 2014-2015, rates hovered around 4.2%, which seemed reasonable at the time. The years 2016-2019 brought steady climbs, with rates reaching the 4.5% to 5.2% range.
Then 2020 happened. Rates plummeted to historic lows of 2.7% as emergency measures kicked in. This created an unprecedented environment where money became incredibly cheap. The rebound started in 2022, with aggressive increases pushing rates above 7% by late 2023 – levels not seen since the early 2000s.
| Year Range | Average Rate | Market Conditions |
|---|---|---|
| 2014-2015 | 4.2% | Stable recovery period |
| 2016-2019 | 4.5-5.2% | Gradual tightening cycle |
| 2020-2021 | 2.7-3.1% | Emergency stimulus era |
| 2022-2023 | 5.8-7.2% | Aggressive rate hiking |
| 2024 | 6.15% | Stabilization phase |
The current 6.15% represents a significant pullback from those peak levels, yet remains nearly double the pre-pandemic norms. This positioning suggests we’re entering a new equilibrium rather than returning to the ultra-low rate environment many became accustomed to.
Market Conditions Driving the Current Percentage
Several powerful forces are shaping today’s 6.15% rate environment. Inflation concerns remain front and center, even though headline numbers have cooled from their peaks. Core inflation continues to run above target levels, keeping pressure on monetary policy decisions.
Employment data shows a labor market that’s still tight but showing signs of balance. Job openings have decreased from their extreme highs, while unemployment remains near historic lows. This creates a goldilocks scenario where the economy isn’t overheating but maintains enough strength to support current rate levels.
Consumer spending patterns reveal interesting dynamics. People are still spending, but they’re becoming more selective. Credit card usage has increased, and savings rates have normalized from pandemic highs. Housing demand remains strong despite higher borrowing costs, indicating underlying economic resilience.
Global economic conditions also play a role. International central banks are navigating similar challenges, creating synchronized policy moves that reinforce current rate levels. Currency stability and international trade flows support the Fed’s current stance.
Key Factors That Influenced the Recent Decline
The drop from peak rates above 7% to the current 6.15% didn’t happen overnight. Several specific catalysts drove this decline, creating the environment we see today.
Banking sector stress earlier in the year sent shockwaves through financial markets. When regional banks faced liquidity challenges, it became clear that maintaining extremely high rates carried systemic risks. Policymakers recognized the need to balance inflation fighting with financial stability.
Economic data began showing signs of cooling that suggested the aggressive tightening cycle was working. Manufacturing activity slowed, business investment became more cautious, and consumer confidence metrics started reflecting higher borrowing costs. These indicators provided cover for a more measured approach.
International developments also influenced the decision-making process. Slower growth in major trading partners and currency volatility created additional reasons to pause the aggressive hiking cycle. The interconnected nature of global finance means domestic policy can’t operate in isolation.
Market functioning improved as well. Bond markets that had experienced significant stress began operating more smoothly. Credit spreads normalized, and liquidity conditions improved across various segments. This gave policymakers confidence that the financial system could handle the current rate level without additional pressure.
The decline represents a recalibration rather than a reversal of policy direction. Officials maintain that rates need to remain restrictive to ensure inflation returns to target levels, but they’ve recognized that the most aggressive phase of tightening has likely concluded.
Breaking Down Historical Highs and Peak Performance
Identifying when and why historical highs occurred
The most dramatic rate spikes in recent history occurred during the late 1970s and early 1980s, when the federal funds rate peaked at an unprecedented 20% in June 1981. This wasn’t some arbitrary decision by overzealous policymakers – it was a desperate response to runaway inflation that had reached double digits. Paul Volcker, the Federal Reserve Chairman at the time, implemented these shock-therapy rates to break the back of inflation expectations that had become deeply embedded in the American economy.
Other notable peaks include the 9.5% rate in May 2000 during the dot-com bubble burst, and the 5.25% ceiling reached in 2006-2007 just before the housing market collapsed. Each of these highs emerged from specific economic pressures: technological speculation, housing euphoria, and most dramatically, the oil crisis-induced stagflation of the Carter era.
What’s fascinating is that these rate increases weren’t gradual adjustments – they were aggressive campaigns designed to shock the system back into equilibrium. The Fed often raised rates in consecutive meetings, sometimes by full percentage points at a time.
Economic conditions during previous peak periods
The economic backdrop during these high-rate periods tells a story of extremes. The early 1980s featured unemployment rates climbing above 10%, oil prices that had quadrupled in less than a decade, and wage-price spirals that seemed unstoppable. Workers demanded higher wages to keep up with inflation, companies raised prices to cover increased labor costs, and the cycle perpetuated itself.
During the 2000 tech bubble peak, the economy was overheating in a different way. Venture capital was flowing like water, companies with no profits were valued in the billions, and the Nasdaq had tripled in just five years. The Fed recognized that asset prices had disconnected from fundamental values and used rate hikes as a cooling mechanism.
The 2006-2007 period saw similar asset price distortions, but this time in housing. Home prices had doubled in many markets, exotic mortgage products were proliferating, and household debt-to-income ratios reached dangerous levels. The Fed’s rate increases were intended to slow lending and restore sanity to credit markets.
Duration and sustainability of past high-rate environments
| Period | Peak Rate | Duration at Peak | Economic Outcome |
|---|---|---|---|
| 1979-1982 | 20% | 8 months above 15% | Severe recession, inflation conquered |
| 2000-2001 | 6.5% | 6 months above 6% | Tech crash, mild recession |
| 2006-2007 | 5.25% | 12 months at peak | Housing collapse, Great Recession |
High rates proved unsustainable in each case, but for different reasons. The Volcker era rates succeeded in their primary mission – breaking inflation – but at enormous economic cost. Manufacturing collapsed, the housing market froze, and unemployment soared. The economy couldn’t function normally with borrowing costs that high for extended periods.
The 2000s peaks were less extreme but equally temporary. Once asset bubbles burst and economic weakness emerged, the Fed quickly reversed course. What’s striking is how rapidly these shifts occurred – from aggressive tightening to emergency loosening within months.
Lessons learned from historical rate cycles
History reveals that sustained high rates create their own economic headwinds. Companies defer investment when borrowing costs spike, consumers delay major purchases, and asset values deflate. The medicine often proves stronger than initially expected, requiring quick policy reversals.
The most successful high-rate campaigns were those with clear, achievable objectives. Volcker’s inflation fight, despite its brutal recession, ultimately restored price stability and Fed credibility. Less successful were rate hikes aimed at gradually deflating asset bubbles, which often triggered the very crashes they sought to prevent.
Another key insight: markets tend to overshoot in both directions. When rates rise aggressively, economic weakness often emerges faster than policymakers anticipate. This creates pressure for rapid reversals, leading to the boom-bust cycles that have characterized much of recent monetary policy history.
The current 6.15% environment sits well below these historical extremes, suggesting either that today’s economic imbalances are less severe or that the Fed has learned to respond more gradually to emerging threats.
Real Impact on Different Market Segments

Effects on Mortgage and Lending Markets
The 6.15% rate environment creates a complex landscape for mortgage and lending markets. Homebuyers face monthly payments that are roughly 30-40% higher compared to the 3% rates seen just two years ago. A $400,000 mortgage now costs approximately $500 more monthly than it would have in 2021, effectively pricing out many first-time buyers and forcing others to consider smaller homes or longer commutes.
Refinancing activity has plummeted by over 80% as homeowners locked into sub-4% rates have zero incentive to refinance. This creates an unusual situation where existing homeowners become reluctant to sell, knowing they’d lose their favorable rates, which further constrains housing supply.
Credit card and personal loan markets show different dynamics. Banks tighten lending standards while simultaneously earning higher spreads on existing variable-rate debt. Auto lending sees mixed results – dealerships struggle with reduced financing appeal, but banks benefit from improved margins on new loans.
Investment Portfolio Performance Implications
Fixed-income investments suddenly look attractive after years of near-zero yields. Treasury bonds, corporate debt, and money market funds offer meaningful returns that compete directly with dividend stocks for income-focused investors. This shift forces a fundamental reassessment of the traditional 60/40 stock-bond allocation.
Stock market valuations face headwinds as higher discount rates make future earnings less valuable in present terms. Growth stocks, particularly those without current profits, suffer disproportionately. Tech companies that thrived in the ultra-low rate environment now compete against risk-free returns approaching 5%.
Real Estate Investment Trusts (REITs) experience dual pressure – higher borrowing costs squeeze their operations while alternative fixed-income investments reduce their appeal to yield-seeking investors. However, REITs with strong balance sheets and locked-in financing may outperform as new development slows due to expensive capital.
Consumer Spending and Saving Behavior Changes
Higher rates reshape consumer psychology around spending and saving decisions. Credit card balances become more expensive to carry, pushing consumers toward debt reduction rather than discretionary purchases. The average household carrying $6,000 in credit card debt now pays an additional $200 annually compared to lower rate periods.
Savings accounts and CDs become viable wealth-building tools again. Many consumers redirect money from risky investments into guaranteed returns, particularly older Americans who can now earn meaningful income from conservative investments without chasing yield in riskier assets.
Big-ticket purchases requiring financing – cars, appliances, home improvements – see reduced demand. Consumers delay purchases or seek lower-cost alternatives. This creates ripple effects through retail sectors dependent on financing availability, while cash-rich consumers gain relative purchasing power in negotiations.
The psychological impact extends beyond pure mathematics. After years of cheap money, consumers adjust expectations about what constitutes normal borrowing costs, leading to more conservative financial planning and increased focus on building emergency funds rather than leveraging for growth.
Economic Indicators Revealing the Bigger Picture

Inflation trends and their relationship to rate changes
The 6.15% rate reflects the Fed’s ongoing battle against inflation, which peaked at 9.1% in June 2022 before cooling to current levels around 3-4%. This relationship isn’t just coincidental – it’s the primary mechanism through which monetary policy works. When rates climb, borrowing becomes more expensive, which slows consumer spending and business investment, eventually putting downward pressure on prices.
What makes this cycle particularly interesting is the lag time. Rate changes typically take 12-18 months to fully impact inflation, meaning we’re still seeing effects from aggressive rate hikes that began in early 2022. The current rate environment suggests the Fed believes inflation is trending toward their 2% target, but they’re maintaining a cautious stance to avoid the mistakes of the 1970s when premature rate cuts allowed inflation to resurge.
Core inflation, which excludes volatile food and energy prices, has shown more persistent stickiness around 4%, indicating that underlying price pressures remain elevated. This explains why rates haven’t dropped more dramatically despite headline inflation improvements.
Employment data and wage growth correlations
The labor market tells a fascinating story alongside these rate changes. Unemployment sits at historically low levels around 3.7%, while job openings have declined from pandemic peaks but remain above pre-2020 levels. This creates a unique dynamic where workers still have bargaining power, but not the extreme leverage seen in 2021-2022.
Wage growth has moderated significantly, dropping from peaks above 5% annually to roughly 3-3.5% currently. This cooling is exactly what the Fed wants to see – strong enough to support consumer spending but not so robust that it fuels persistent inflation through wage-price spirals.
The quits rate, which measures voluntary job departures, has also normalized, suggesting workers are less confident about finding better opportunities. This behavioral shift indicates that higher rates are having their intended effect on labor market dynamics without triggering mass unemployment.
Federal Reserve policy decisions and future guidance
Fed communications have shifted from aggressive hawkishness to a more measured “higher for longer” approach. Their dot plot projections suggest officials expect rates to remain elevated through 2024, with potential cuts contingent on sustained inflation progress.
The central bank faces a delicate balancing act. Cut too early, and inflation could reignite. Wait too long, and they risk triggering an unnecessary recession. Recent Fed speeches emphasize data dependency, meaning each meeting will hinge on incoming economic indicators rather than predetermined schedules.
Market expectations often diverge from Fed guidance, with investors frequently pricing in more aggressive cuts than officials project. This disconnect creates volatility and uncertainty that ripples through all financial markets.
Global economic factors influencing domestic rates
International developments significantly impact domestic rate decisions, even though the Fed primarily focuses on US economic conditions. China’s economic reopening and subsequent slowdown have affected global commodity prices and supply chains, influencing US inflation dynamics.
European Central Bank policies and the strength of the US dollar create cross-currents that complicate Fed decision-making. When other major central banks maintain higher rates, it supports the dollar but can also import deflationary pressures through cheaper imports.
Geopolitical tensions, particularly energy market disruptions, continue to pose upside risks to inflation that the Fed must consider when setting policy. Recent oil price volatility demonstrates how quickly external shocks can complicate domestic monetary policy calculations.
Strategic Opportunities Emerging from This Rate Environment

Investment Strategies That Benefit From Current Conditions
Fixed-income investments are having their moment again. With rates at 6.15%, Treasury bonds, high-grade corporate bonds, and CDs offer returns that haven’t been available for years. Investors who’ve been starved for yield can now build laddered bond portfolios that provide steady income streams while preserving capital.
Value stocks are looking more attractive relative to growth stocks. Higher rates make future cash flows worth less in present value terms, which hits growth companies harder than value plays. Companies trading at reasonable price-to-earnings ratios with strong dividend yields are becoming the smart money’s favorite picks.
Real estate investment trusts (REITs) focused on essential services like data centers, healthcare facilities, and distribution warehouses offer opportunities. While residential REITs face headwinds, these specialized sectors can pass through higher costs to tenants through inflation-adjusted leases.
Refinancing and Debt Management Advantages
Smart borrowers are taking advantage of the rate environment by restructuring their debt profiles. Those with variable-rate debt are locking in fixed rates where possible, especially on credit cards and home equity lines of credit.
Cash-rich companies are retiring high-cost debt early and replacing it with lower-cost alternatives. The spread between junk bonds and investment-grade debt has created arbitrage opportunities for companies that can improve their credit ratings.
Homeowners with adjustable-rate mortgages from the ultra-low rate period are exploring rate caps, extensions, or modifications before their rates reset higher. Credit unions and community banks are offering competitive deals to attract quality borrowers.
Business Expansion and Capital Allocation Decisions
Companies with strong balance sheets are finding acquisition opportunities as overleveraged competitors struggle with debt service costs. Private equity firms are raising larger funds to take advantage of distressed asset sales.
Capital-intensive businesses are accelerating equipment purchases before financing costs rise further. The tax advantages of immediate depreciation combined with current financing rates create a narrow window for strategic investments.
Service-based businesses are expanding through organic growth rather than debt-financed acquisitions. They’re focusing on building recurring revenue streams that can support higher borrowing costs in the future.
Long-term Wealth Building Approaches for Individuals
Young investors are embracing the return of compound interest. High-yield savings accounts and money market funds now offer meaningful returns for emergency funds and short-term goals. This creates a foundation for more aggressive investment strategies with excess capital.
Dollar-cost averaging into diversified index funds remains powerful, especially with dividend-focused strategies gaining traction. The combination of regular contributions and reinvested dividends at higher yields accelerates wealth accumulation.
Roth IRA conversions make sense for investors in lower tax brackets who can pay today’s taxes in exchange for tax-free growth in a higher-rate environment. The math works particularly well for early-career professionals and recent retirees.

The current 6.15% rate tells a complex story when you put it next to historical peaks and market patterns. This drop isn’t just a number on a chart – it’s revealing shifts in economic conditions that affect everything from your mortgage payments to investment returns. Different market segments are responding in their own ways, and the economic indicators paint a picture that’s more nuanced than headlines might suggest.
Smart investors and everyday people alike should pay attention to the strategic opportunities emerging from this rate environment. Instead of panicking about the drop or celebrating too early, focus on understanding what your specific financial situation needs right now. This market correction offers a chance to reassess your position and make moves that align with both current conditions and your long-term goals. The key is staying informed and ready to adapt as these economic patterns continue to unfold.